Why Breakouts Fail—and How to Recognize a False Breakout
A breakout can look like one of the easiest trading opportunities.
A stock moves above resistance. The candle closes strongly. Volume appears to increase. Traders enter expecting the price to continue higher.
Then suddenly, the price falls back below the breakout level.
The breakout has failed.
This is known as a false breakout or fake breakout, and it is one of the common situations that can trap traders—especially beginners.
Understanding why breakouts fail and learning how to identify warning signs can help traders make more disciplined decisions.
What Is a Breakout?
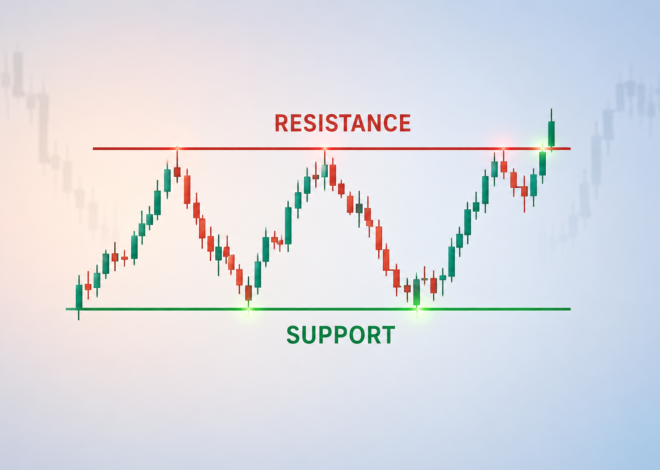
A breakout happens when the price moves beyond an important support or resistance level.
For example, suppose a stock has repeatedly struggled to move above ₹500.
₹500 becomes an important resistance level.
If the stock eventually moves above ₹500 with strong buying activity, traders may consider this a bullish breakout.
The expectation is that the old resistance could potentially become a new support level.
But a price moving above resistance does not automatically mean the breakout is genuine.
That is where false breakouts become important.
What Is a False Breakout?
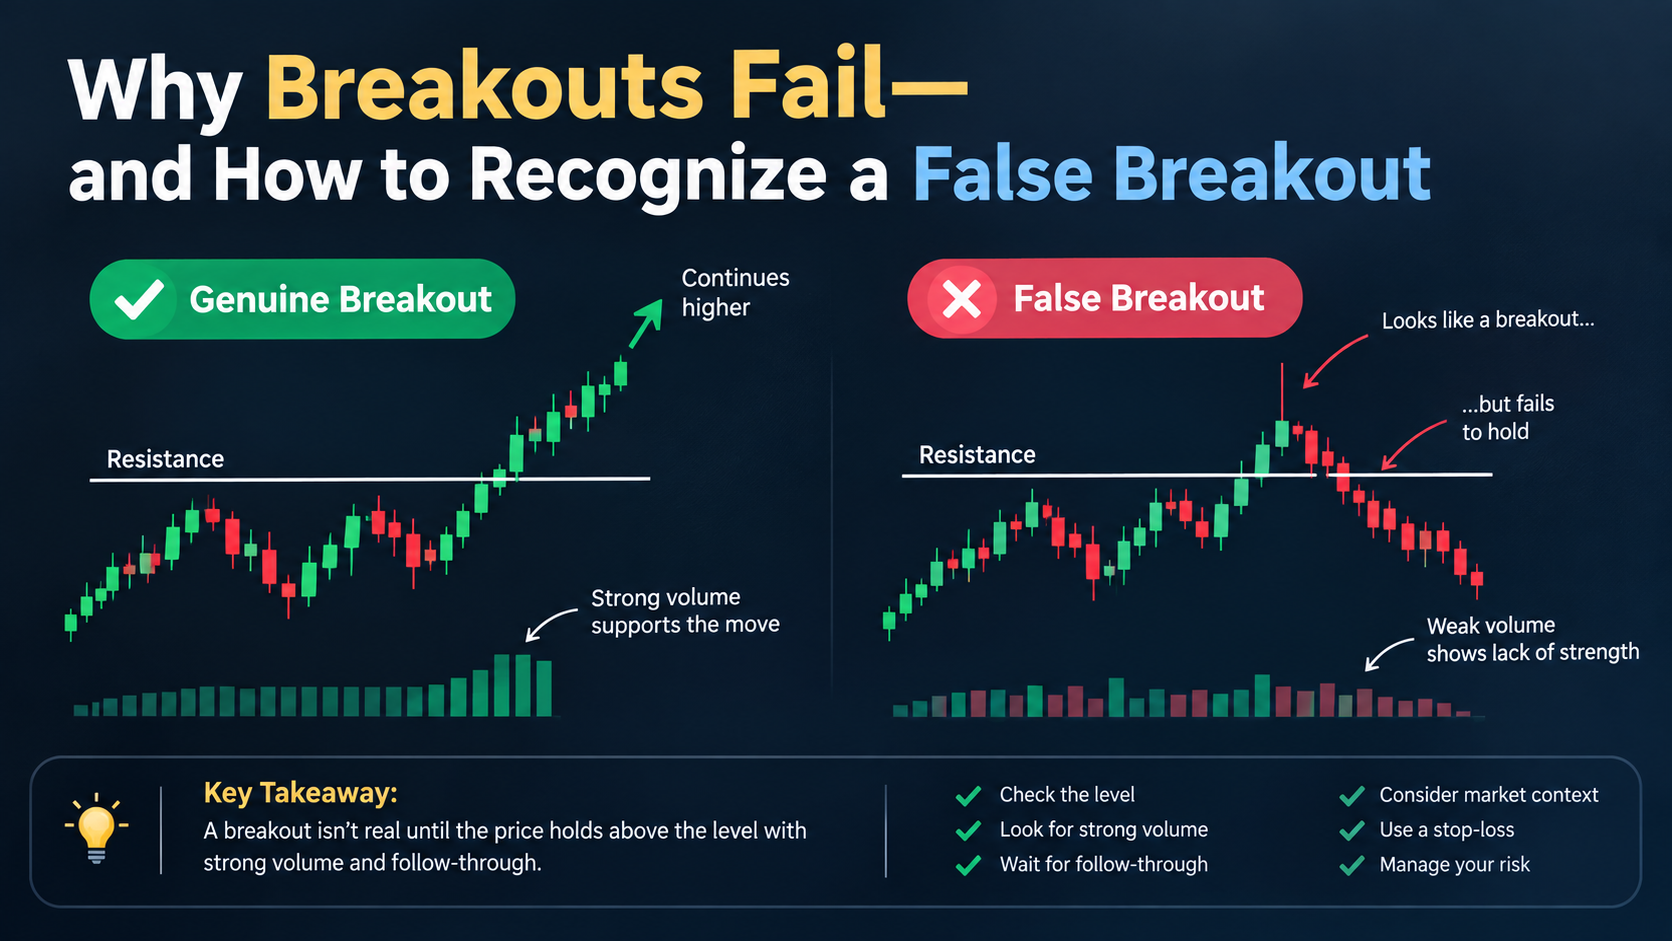
A false breakout occurs when price moves beyond a key level but fails to sustain that move.
For example:
Resistance: ₹500
Price: ₹495 → ₹502 → ₹505 → ₹498 → ₹490
The stock initially breaks above ₹500, attracting buyers.
But instead of continuing higher, it quickly falls back below ₹500.
Traders who entered during the breakout may now be trapped in losing positions.
This is why traders should avoid treating every breakout as a guaranteed opportunity.
Why Do Breakouts Fail?
There isn’t always one specific reason. Several factors can contribute to a failed breakout.
1. Weak Buying Pressure
A stock can move above resistance without having enough genuine buying strength behind the move.
Sometimes the breakout happens with relatively low participation.
Without sustained demand, the price may struggle to continue.
2. Traders Enter Too Early
Many traders enter as soon as the price moves slightly above resistance.
But a small move above a level isn’t necessarily confirmation.
Price may briefly cross the level and then reverse.
Waiting for additional confirmation can help reduce the risk of entering immediately into a false move.
3. Low Volume
Volume can provide useful context.
A breakout accompanied by noticeably stronger volume may indicate greater participation.
On the other hand, if price breaks resistance while volume remains weak, traders may want to be more cautious.
Volume should not be used alone, but it can be an important supporting factor.
4. The Market Is Moving in the Opposite Direction
A stock may show a bullish breakout while the broader market is weak.
For example, if the overall index is experiencing strong selling pressure, individual stocks can struggle to maintain breakouts.
Market context matters.
5. The Level Was Not Strong Enough
Not every resistance level has the same importance.
A level that price touched once may not have the same significance as a level that rejected price multiple times.
The more meaningful the level, the more attention traders may give to the breakout.
6. Stop-Loss Hunting and Liquidity
Markets contain large numbers of orders around obvious price levels.
When a widely watched resistance level breaks, many traders may enter long positions while short sellers may place stop-loss orders nearby.
Price can move through the level, trigger those orders, and then reverse.
This is one reason a quick move above resistance should not automatically be considered confirmation.
How to Recognize a False Breakout
There is no perfect method for predicting whether a breakout will fail.
However, several warning signs can help traders evaluate the setup.
Warning Sign #1: Price Quickly Returns Below Resistance
This is one of the clearest signs.
If price breaks above resistance but soon closes back below it, the breakout deserves caution.
The faster the rejection, the more carefully traders should examine what happened.
Warning Sign #2: Long Upper Wick
Imagine a candle moves strongly above resistance but closes much lower, leaving a long upper wick.
This can indicate that sellers entered at higher prices.
A single candle doesn’t confirm a false breakout, but it can provide an important warning.
Warning Sign #3: Breakout Without Strong Volume
If the price moves through resistance but participation does not increase meaningfully, the move may lack conviction.
Again, volume is not a standalone signal.
It should be considered alongside price structure and market conditions.
Warning Sign #4: No Follow-Through
A genuine breakout often needs follow-through.
For example:
Day 1: Price breaks resistance.
Day 2: Price remains above the level and continues higher.
If instead the stock immediately stalls and falls back below resistance, traders should question the strength of the breakout.
Warning Sign #5: Breakout Occurs Into Major Resistance
Sometimes traders focus on one resistance level while ignoring another important level nearby.
A stock might break ₹500 but face major resistance at ₹510.
If the distance between the breakout and the next major resistance is very small, the trade may have limited room to move.
Breakout vs False Breakout
A simple comparison can help.
| Genuine Breakout | False Breakout |
|---|---|
| Price moves beyond resistance | Price briefly moves beyond resistance |
| Stronger participation may appear | Participation may be weak |
| Price holds above the level | Price quickly returns below it |
| Follow-through is visible | Follow-through is missing |
| Previous resistance may act as support | Previous resistance fails to hold |
This isn’t a guaranteed checklist.
Markets don’t follow fixed rules every time.
The goal is to improve the quality of your decision-making—not to predict every move.
The Retest: An Important Concept
One approach traders often watch after a breakout is the retest.
Suppose resistance is at ₹500.
The stock breaks above ₹500 and moves to ₹515.
Instead of immediately continuing higher, price returns toward ₹500.
If ₹500 now behaves like support and buyers step in again, traders may view the retest as additional evidence that the breakout could be holding.
However, even a successful retest does not guarantee that price will rise.
Risk management is still essential.
Don’t Confuse Speed With Strength
A common mistake is assuming that a very fast breakout must be a strong breakout.
A sudden price spike can attract attention and create FOMO—fear of missing out.
Traders may enter simply because the stock is moving quickly.
But speed alone doesn’t tell you whether the move is sustainable.
Instead of asking:
“How quickly is the stock moving?”
Consider asking:
“Is the price sustaining the breakout?”
That change in thinking can make a significant difference.
A Simple Breakout Checklist
Before trading a breakout, traders can consider asking:
1. What level is being broken?
Is it meaningful support or resistance?
2. Did the candle close beyond the level?
A temporary move through resistance may not be enough.
3. Is volume supporting the move?
Look for meaningful participation rather than relying on price alone.
4. Is there follow-through?
Does price continue to hold the breakout area?
5. What is the broader market doing?
Is the market supporting or opposing the trade?
6. Where is the invalidation level?
Before entering, know where the trade idea would be considered wrong.
7. Is the risk-to-reward reasonable?
A good-looking breakout is not automatically a good trade.
Risk Management Still Comes First
Even the strongest-looking breakout can fail.
That is why traders should not build a strategy around being right every time.
Instead, the focus should be on managing risk when the trade doesn’t work.
A trader might define:
- Entry point
- Stop-loss level
- Target area
- Position size
- Maximum acceptable loss
The exact approach will differ depending on the trader’s strategy and timeframe.
The important lesson is simple:
Don’t let one false breakout turn into a large loss.
The Psychology Behind False Breakouts
False breakouts are particularly powerful because they trigger emotions.
A trader sees price breaking resistance and thinks:
“If I don’t enter now, I’ll miss the move.”
That creates FOMO.
The trader enters.
Price reverses.
Now the trader may hesitate to exit because they believe the breakout will recover.
A small planned loss can eventually become a much larger loss.
This is why trading discipline is often more important than finding the “perfect” indicator.
Final Thoughts
Breakouts can provide interesting trading opportunities, but not every breakout deserves an immediate entry.
A move above resistance is only one piece of information.
Traders should also consider:
Price action + Volume + Market context + Follow-through + Risk management
A false breakout cannot always be predicted in advance.
But by learning to recognize warning signs—such as quick rejection, weak volume, long upper wicks, and lack of follow-through—you can become more selective about the setups you trade.
The goal isn’t to avoid every losing trade.
The goal is to avoid unnecessary trades and manage risk when your analysis turns out to be wrong.
Trade the setup. Manage the risk. Don’t trade the excitement.
Key Takeaway
A breakout is not confirmed simply because price crosses a resistance level.
Wait for evidence that the market is actually accepting prices above the level.
Because sometimes, the breakout isn’t the opportunity.
The failed breakout is the warning.
Educational content only. This article is for learning purposes and should not be considered financial advice or a recommendation to buy or sell any security.