Support and Resistance Explained: A Complete Guide for Traders
Introduction
Support and resistance are two of the most important concepts in technical analysis. Whether you are a beginner learning stock market basics or an experienced trader looking for better trade setups, understanding these levels can help you read price movements more effectively.
Instead of trying to predict exactly where a stock will move, support and resistance help traders identify areas where price may pause, reverse, or break through.
In this guide, we will explain support and resistance in simple terms, how to identify them on a chart, how to use them in trading, common mistakes to avoid, and how to combine these levels with other technical analysis tools.
What Is Support in Trading?
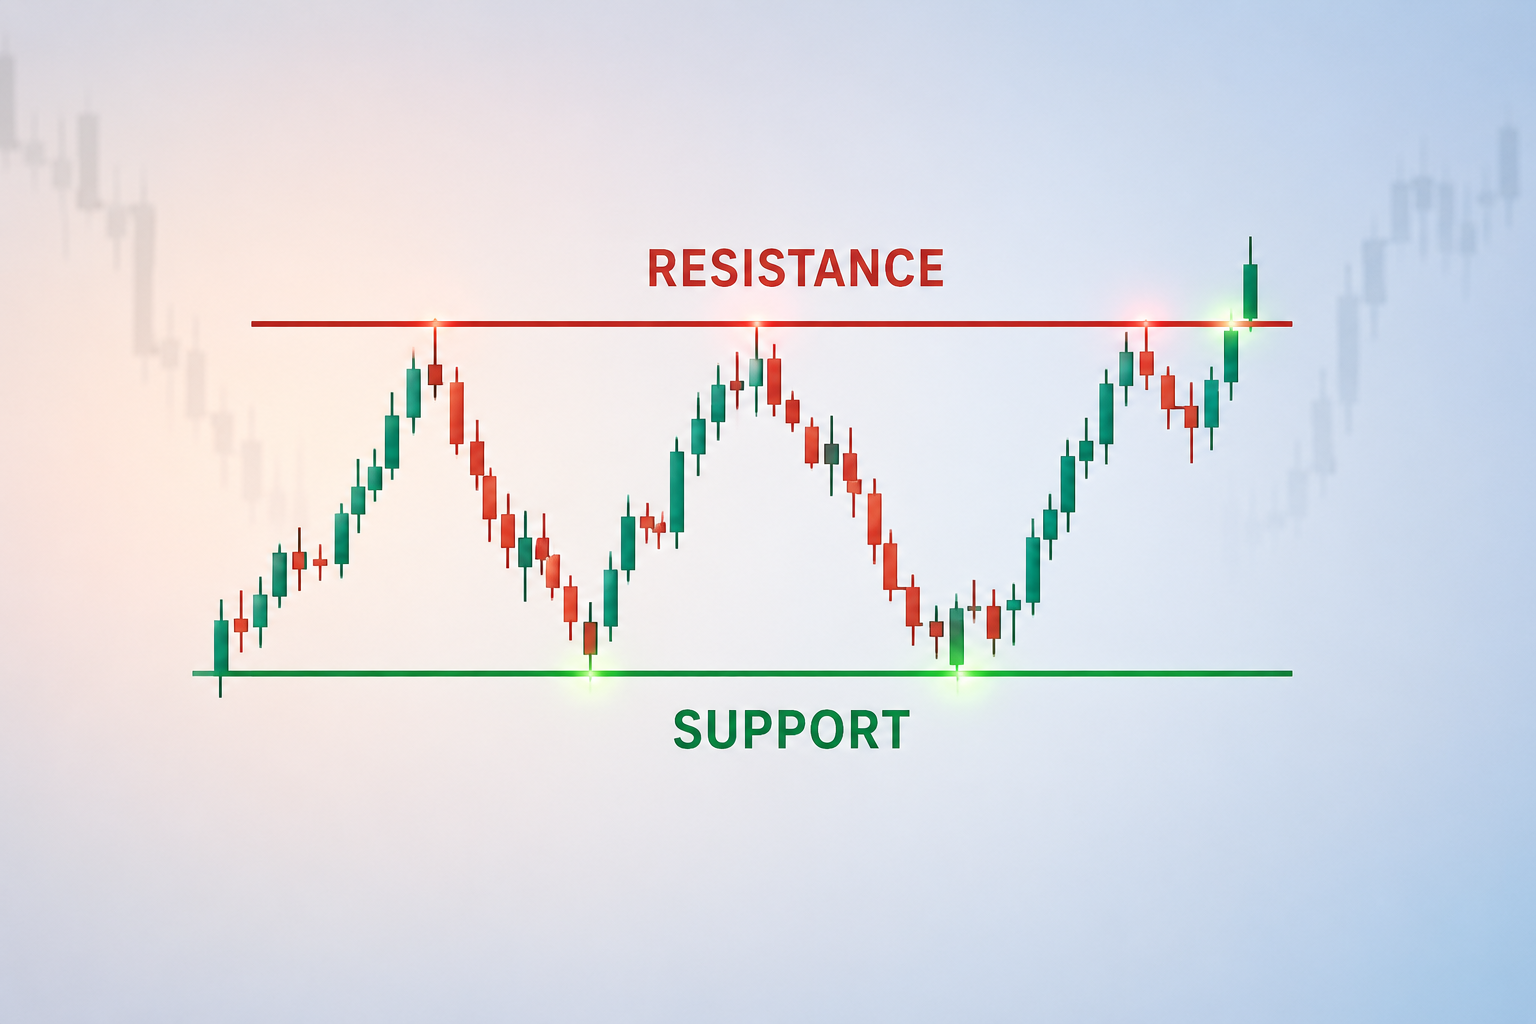
Support is a price area where buying interest has historically been strong enough to prevent or slow down a further decline.
Think of support as a floor.
When the price of a stock falls toward a support zone, buyers may become more interested because they believe the price is attractive. If enough buyers enter the market, selling pressure can weaken and the price may bounce.
Example
Suppose a stock repeatedly falls toward ₹500 but struggles to move below that level.
₹500 may become an important support area.
However, support is not always an exact price. It is usually better to think of it as a support zone.
For example:
₹495–₹505 = Support Zone
Price may temporarily move below ₹500 without completely invalidating the support.
What Is Resistance in Trading?
Resistance is a price area where selling pressure has historically been strong enough to prevent or slow down further price increases.
Think of resistance as a ceiling.
When a stock approaches a resistance zone, some traders may sell their positions, while other market participants may wait for confirmation before buying.
Example
Imagine a stock repeatedly rises toward ₹800 but fails to move significantly above it.
₹800 could become an important resistance level.
A trader may therefore watch the ₹790–₹810 area for signs of rejection or a potential breakout.
Support vs Resistance
| Support | Resistance |
|---|---|
| Acts like a floor | Acts like a ceiling |
| Usually found below current price | Usually found above current price |
| Buyers may become active | Sellers may become active |
| Can lead to a bounce | Can lead to a pullback |
| Break below may signal weakness | Break above may signal strength |
The key idea is simple:
Support = area where demand may appear.
Resistance = area where supply may appear.
How to Identify Support and Resistance
There are several ways traders identify important levels on a chart.
1. Previous Swing Highs and Lows
One of the simplest methods is to look at previous turning points.
If price repeatedly falls and reverses from a similar area, that area may act as support.
If price repeatedly rises and reverses from a similar area, that area may act as resistance.
This is often the best starting point for beginners.
2. Multiple Touches
A level that has been tested several times can become more noticeable to traders.
For example:
- Price reaches ₹1,000 and falls
- Price reaches ₹1,000 again and falls
- Price reaches ₹1,000 a third time and struggles again
The ₹1,000 region may now be considered an important resistance zone.
However, more touches do not automatically guarantee that the level will hold forever.
Eventually, strong buying or selling pressure can cause a breakout.
3. Psychological Price Levels
Round numbers can sometimes attract attention from traders.
Examples include:
- ₹100
- ₹500
- ₹1,000
- ₹2,000
These levels may become important because many market participants naturally pay attention to them.
But psychological levels should not be used alone. Price action and market context still matter.
4. Trendlines
Trendlines can also help identify dynamic support and resistance.
In an uptrend, a rising trendline may act as support as price makes higher lows.
In a downtrend, a falling trendline may act as resistance as price makes lower highs.
The important point is that trendline support and resistance can change over time.
5. Moving Averages
Moving averages can sometimes act as dynamic support or resistance.
For example, traders may watch commonly used moving averages such as:
- 20-period moving average
- 50-period moving average
- 100-period moving average
- 200-period moving average
A moving average is not a guaranteed support or resistance level. It should be considered alongside price action and the overall trend.
Static vs Dynamic Support and Resistance
Support and resistance can generally be divided into two categories.
Static Levels
Static levels remain at approximately the same price.
Examples include:
- Previous swing highs
- Previous swing lows
- Major breakout levels
- Historical price zones
- Important psychological levels
Dynamic Levels
Dynamic levels move as the chart develops.
Examples include:
- Moving averages
- Trendlines
- Channels
Understanding both types can give traders a broader view of market structure.
What Happens When Support Breaks?
A support level does not always hold.
When price moves decisively below an important support area, traders may interpret it as a sign of increased selling pressure.
For example:
Support → Breakdown → Possible Retest → Further Decline
One interesting concept is that old support can sometimes become new resistance after a breakdown.
Suppose a stock has strong support around ₹500.
If price breaks below ₹500 and later rises back toward ₹500 but gets rejected, the previous support may now behave as resistance.
This is commonly called a support-resistance flip.
What Happens When Resistance Breaks?
The opposite can happen when price breaks above resistance.
For example:
Resistance → Breakout → Possible Retest → Continuation
Suppose a stock repeatedly struggles around ₹1,000.
If buyers eventually push price above ₹1,000 with strong participation, traders may watch whether the price can hold above that area.
If the old resistance becomes new support, it may provide additional confirmation that the breakout is holding.
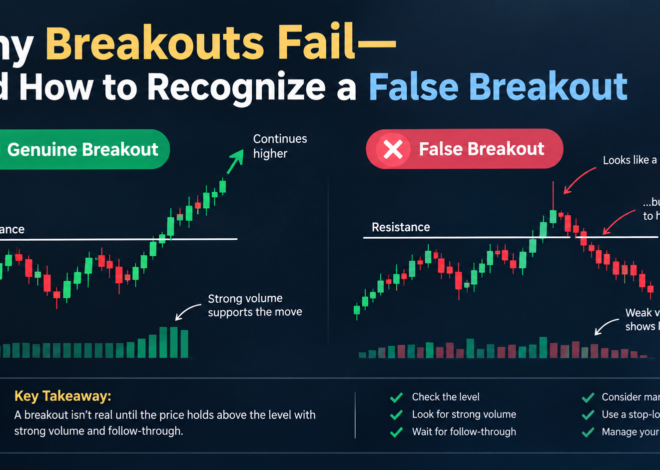
Breakout vs False Breakout
Not every move beyond support or resistance is a genuine breakout.
Sometimes price moves above resistance briefly and then falls back below it.
This is known as a false breakout or failed breakout.
Similarly, price can temporarily move below support before recovering.
What Traders May Watch
Before treating a breakout as significant, traders may consider:
- Closing price
- Volume
- Candle structure
- Market trend
- Momentum
- Retest of the broken level
- Broader market conditions
No single factor guarantees that a breakout will succeed.
How to Trade Support and Resistance
Support and resistance can be incorporated into different trading approaches.
Strategy 1: Buying Near Support
A trader may look for a bullish setup near an established support zone.
For example:
Price approaches support → Selling slows → Bullish confirmation → Entry
A stop-loss may be placed below the relevant support area depending on the trader’s risk management plan.
The exact entry and stop-loss should depend on the setup rather than simply buying whenever price touches support.
Strategy 2: Selling Near Resistance
A trader may watch for signs of weakness near resistance.
For example:
Price approaches resistance → Buying slows → Bearish confirmation → Entry
Again, resistance does not guarantee a reversal.
Strong buying pressure can push price through the level.
Strategy 3: Breakout Trading
Some traders prefer trading when price breaks through an important resistance or support level.
For a bullish breakout:
Resistance breaks → Price holds above level → Confirmation → Possible entry
For a bearish breakdown:
Support breaks → Price holds below level → Confirmation → Possible entry
Breakout traders should be particularly careful about false breakouts.
Support and Resistance With Volume
Volume can provide additional context.
Imagine a stock approaches resistance and breaks above it with noticeably higher trading volume.
Some traders may consider this stronger evidence than a breakout that occurs with very little participation.
Similarly, a breakdown below support accompanied by increased selling activity may receive more attention.
However, volume should not be treated as a guarantee.
Price tells you what happened. Volume can provide additional context about participation.
Support and Resistance in Different Timeframes
A support or resistance level on a daily chart may be more significant than a minor level visible only on a five-minute chart.
Traders often use multiple timeframes to understand the bigger picture.
For example:
Higher timeframe → Identify major levels
Lower timeframe → Look for trade setup
A swing trader may focus more on daily and weekly charts, while an intraday trader may combine hourly, 15-minute, or 5-minute charts with higher-timeframe analysis.
The best timeframe depends on the trading style and strategy.
Common Mistakes Traders Make
1. Treating Levels as Exact Prices
Support and resistance are usually zones, not perfectly precise lines.
Avoid assuming that a stock must reverse at exactly ₹500.
2. Entering Immediately at Every Level
A price touching support does not automatically mean “buy.”
Likewise, reaching resistance does not automatically mean “sell.”
Look for confirmation and consider the overall market structure.
3. Ignoring the Trend
A support level in a strong downtrend may fail.
A resistance level in a strong uptrend may eventually break.
Always consider the broader trend.
4. Using Too Many Levels
A chart filled with dozens of horizontal lines can become confusing.
Focus on the most meaningful areas that price has clearly reacted to.
5. Ignoring Risk Management
Even a well-identified support or resistance level can fail.
That is why traders should define:
- Entry
- Stop-loss
- Position size
- Risk per trade
- Potential target
before taking a trade.
A Simple Support and Resistance Trading Checklist
Before taking a trade, ask yourself:
- Where is the nearest major support?
- Where is the nearest major resistance?
- What is the overall trend?
- Has price reacted to this level previously?
- Is the level from a higher timeframe?
- Is volume supporting the move?
- Is there confirmation?
- Where will the stop-loss be?
- How much am I risking?
- Is the potential reward worth the risk?
This simple process can help traders avoid impulsive decisions.
Support and Resistance Example
Consider a hypothetical stock trading at ₹750.
Suppose:
- Support = ₹700
- Resistance = ₹800
- Current price = ₹750
The stock is trading between two important zones.
A trader could monitor what happens when price approaches either boundary.
Scenario A: Price Approaches ₹700
If price reaches ₹700 and shows signs of buying interest, a potential bullish setup may develop.
Scenario B: Price Breaks Below ₹700
If price decisively breaks below support, the previous support may become resistance during a retest.
Scenario C: Price Approaches ₹800
If price reaches ₹800 and selling pressure appears, the stock may pull back.
Scenario D: Price Breaks Above ₹800
If price breaks and holds above ₹800, traders may watch the level for a potential retest and continuation.
The important lesson is that the level itself is not the trade. The reaction around the level is what traders analyze.
How Beginners Can Practice Support and Resistance
If you are new to technical analysis, start with historical charts.
Choose a liquid stock and:
- Open the daily chart.
- Identify major swing highs and lows.
- Mark important zones.
- Look for previous reactions.
- Move to a lower timeframe.
- Observe how price behaves around those zones.
- Record your observations in a trading journal.
Paper trading can also help you practice without immediately putting real capital at risk.
Support and Resistance Are Not Predictions
One of the biggest misconceptions is that support and resistance can predict exactly what the market will do.
They cannot.
They are decision-making tools, not crystal balls.
A support zone can break.
A resistance zone can fail.
A breakout can become a false breakout.
The goal of technical analysis is not to predict every move. The goal is to build a trading process where you can manage risk when your analysis is wrong.
Final Thoughts
Support and resistance are foundational concepts in technical analysis.
Once you understand how to identify meaningful price zones, you can begin to understand market structure more clearly and plan trades with greater discipline.
Remember:
Support is an area where buying interest may appear.
Resistance is an area where selling pressure may appear.
Breakouts can create new opportunities—but they can also fail.
Risk management is more important than being right every time.
Whether you are learning intraday trading, swing trading, or options trading, support and resistance can become an important part of your technical analysis toolkit.
If you want to build a stronger foundation in technical analysis and practical trading, structured learning and consistent chart practice can help you develop the skills needed to analyze markets more confidently.
Frequently Asked Questions
1. What is support and resistance in trading?
Support is a price area where buying interest may prevent or slow a decline. Resistance is a price area where selling pressure may prevent or slow an increase.
2. Is support always a specific price?
No. Support is often better viewed as a zone rather than an exact price.
3. Can support become resistance?
Yes. After a breakdown, a previous support area can sometimes become resistance when price retests it.
4. Can resistance become support?
Yes. After a successful breakout, a previous resistance level can sometimes become support.
5. Is support and resistance useful for intraday trading?
Yes. Intraday traders commonly use support and resistance to identify potential entry areas, breakout opportunities, stop-loss locations, and targets.
6. Which timeframe is best for support and resistance?
There is no single best timeframe. Higher timeframes can help identify major levels, while lower timeframes can help with trade execution.
7. Can support and resistance guarantee profitable trades?
No. These levels are analytical tools, not guarantees. Every trade carries risk, which is why proper position sizing and risk management are essential.
8. What is the difference between support and resistance?
Support generally acts as a potential floor beneath price, while resistance generally acts as a potential ceiling above price.
9. What indicators can be combined with support and resistance?
Traders may combine these levels with volume, moving averages, trendlines, momentum indicators, and price-action patterns for additional context.
10. Should beginners use support and resistance alone?
Beginners should avoid relying on a single tool. Support and resistance work best when combined with market structure, confirmation, and disciplined risk management.
Disclaimer: This article is for educational purposes only and should not be considered investment or trading advice. Financial markets involve risk, and traders should conduct their own research and consider their risk tolerance before making financial decisions.

Related Posts

Why a Stock Can Rise Even When the News Looks Bad